Senior Housing Economic Research Report: Spending Patterns of Older Americans
By Edward Seiler
7 min read
A better understanding of your residents’ needs
America is aging. So much so, that by 2035 one-third of U.S. households will be headed by someone 65 or older, and 16 million households by someone 80 or older. If we are going to construct affordable housing for the growing 65+ demographic, it would seem of value to understand their needs and spending patterns.
We tend to talk about aged and retired Americans as if they are all in the same boat, but obviously they are not. In fact, most people are in their own boat. But we can see certain behavioral patterns. Over time, needs change. And, given the impact of longevity, the amount of that time can be longer than ever. So, it would seem helpful to someone renting to older adults to have an understanding of these patterns of needs and resultant expenditures through the aging process.
Earlier in my career, a colleague and I studied patterns of vacation travel among seniors—how they increased after retirement but declined in later years as health and budget considerations came to the forefront. In a similar vein, here we will examine how American seniors’ spending patterns evolve as their budgets, general health, cognitive abilities and household structures change by summarizing, for different post-retirement age groups, senior households’ core expense categories (including housing, food, health, transportation, clothing, entertainment, pensions and Social Security, and intra-family transfers).
We will proceed in two steps. First, by reviewing the main results from a series of articles written by Sudipto Banerjee from the Employee Benefit Research Institute (EBRI). These papers use Health and Retirement Study data from 2001 to 2011 to examine consumption patterns among older Americans. We will then complement and update this view by analyzing Consumer Expenditure Survey (CE) data from 2017 and examine how the 2017 spending patterns relate to 2013 to 2014 CE results published by Anne Foster of the Bureau of Labor Statistics (BLS).
Please note that the data will present us with national figures. Actual expenditures will, among other factors, vary based on locale and lifestyle.
Spending Patterns Across Ages — Findings from Health and Retirement Study Data
The University of Michigan Health and Retirement Study (HRS) is a biennial nationally representative longitudinal survey of approximately 20,000 people in America over age 50 that is used to apprise us on the challenges and opportunities of aging (e.g., senior healthcare, housing, assets, pensions, employment and disability). Since 2001, the HRS also includes supplemental Consumption and Activities Mail Survey (CAMS) data that provides detailed expenditure data from 5,000 households.
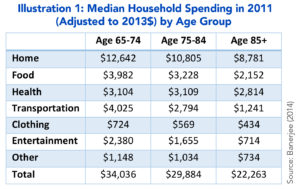
Illustration 1 shows median household expenditures from the 2011 HRS-CAMS, by age group, for six core consumption categories.
The first thing to note from Illustration 1 is that these categories are broad. For example, the home-related expenses combine mortgage payments, rent, utilities, taxes, fees, repairs, furnishings and more. With that said, home-related spending is the biggest expense category for all age groups, comprising almost 40 percent of expenditures in older households.
Median expenses drop sharply as seniors age. This is true for all categories except (out-of-pocket) health expenditures. These are flat between the 65 to 74 and 75 to 84 age groups, and then fall by (only) nine percent as seniors age over 85. Note, however, that since average household size decreases with age, per-capita healthcare expenses may actually increase. (We will further explore this in the next section).
To gain a deeper understanding of these expenditure patterns, Banerjee drills down in the data and examines household expenditure distributions. In Illustration 2, we show the distribution of overall household expenditures (left panel) and healthcare expenditures (right panel) for four age groups – including pre-retirees.
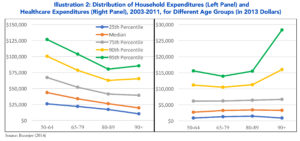
Consistent with Illustration 1, the median (in the left panel) falls as seniors age. Overall median expenditures drop by 55 percent across the four age groups. The expenditure distribution narrows as seniors retire and age through their eighties but widens as spending ticks up for the 90th and 95th percentile (highest spending) groups in their nineties. To understand why, we turn to the distribution of healthcare expenditures in the right panel. Until age 90, the distribution appears relatively even, but then fans out as health spending increases sharply for the top two groups in their 90s. Banerjee notes, “That for some people, end-of-life health care spending can be very high.”
Spending Patterns Across Ages—Findings from Consumer Expenditure Survey Data
CE data, collected by the Census Bureau for BLS, provides information on the complete range of consumers’ expenditures, as well as their incomes and demographic characteristics. BLS publishes 12-month estimates of consumer expenditures twice a year, and the 2017 midyear tables (we use here) are based on the 3rd quarter 2016 through the 2nd quarter 2017.
Before we examine household expenditures it is important to give ourselves more context and understand how household features change over the senior years. Illustration 4 shows how selected household characteristics evolve by generation.
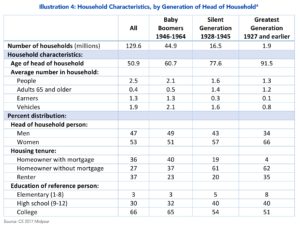
Illustration 5 shows mean household income and expenditures from the 2017 midyear CE, by the generation of the reference person in the household.
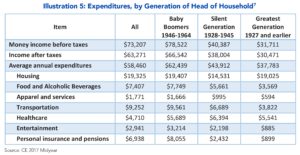
The first thing to note from this table is that, as seniors age, the decrease in expenditures is slower than the decrease in net income. The two oldest generations thus need, on average, to tap savings (or other resources).
For all three groups, housing is the biggest expense, accounting for over 30 percent of total mean spending. Drilling down into the sub-categories of housing costs we see that:
- The decrease of almost $5,000 from the Baby Boomers to the Silent Generation is in no small part due to lower averagemortgage payments (40 percent of Boomers have mortgages versus 19 percent for the Silent Generation).
- The increase from the Silent to the Greatest Generation is driven by renting. The average household rent paid by the Silent Generation is $2,167 versus $8,312 for the Greatest Generation. Note that this finding is not evident in Foster’s papers (referenced above) since the oldest category she reports is 75+ (where housing expenses are lower than for the 65 to 74 age group).
Transportation expenditures decline with age as households own fewer vehicles. The CE data also shows that non-ownership expenditures (e.g., vehicle rentals and public and other transportation) decrease as seniors age. It thus appears that older seniors travel less and may not be as reliant on public transportation or taxi services as we may have anticipated.
Healthcare expenditure patterns are similar to those discussed above for HRS data and to Foster’s findings for older CE data. While this expense decreases, on average, from $6,394 (Silent Generation) to $5,541 (Greatest Generation), we see in Illustration 4 that household size decreases by a fifth between these two groups. As such, per-person spending increases. We will continue to track senior out-of-pocket health expenditures as Medicare/Medicaid and the Affordable Care Act evolve.
In Closing
Understanding what suitable affordable housing means to the large and growing senior population is directly related to their expenditure patterns. What can they afford given their other financial obligations and needs? Thankfully, detailed data are available to study how spending evolves as seniors transition into retirement and as their budgets, general health, cognitive abilities and household structures change in their retirement years.
SIDEBAR
Inter-generational intra-family cash transfers: An expenditure that is often overlooked
The 2010 HRS survey data show that over the two-year period between 2008 and 2010 over 40 percent of older households gave transfers to children and grandchildren, while only five percent received transfers from younger family members. Intra-family transfers to younger generations are thus a net expenditure for many seniors.
Intra-family transfers made by older Americans are summarized in Illustration 3.
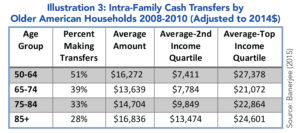
Note that since fewer than 50 percent of households over the age of 65 are making intra-family transfers, the median transfer is zero. However, when transfers are made they are sizable. For example, of the 33 percent of age 75 to 84 households that made transfers in the two-year period, the average amount was $14,704. Transfers are also higher for higher income families.