Economic Research Report: Estimating the Local Economic Impacts of Building Affordable Housing
By Edward Seiler
8 min read
Background
According to the National Low Income Housing Coalition’s influential 2019 Gap report, the nation’s lowest-income households face a shortage of over seven million affordable and available rental homes. Despite this, development of affordable units is often held up by NIMBYism—a manifestation of the local (pecuniary, perceived and other) costs of building affordable homes. Among the counterbalances to these costs are the positive economic impacts of affordable housing construction that bring tangible benefits to the local economy.
If we are to tackle the shortage of affordable homes, it is essential to understand the magnitude of the economic impacts of increased production and how they benefit the local population.
The major economic impacts from building affordable housing units are job creation, increased spending and tax revenue. Homebuilding creates direct jobs for workers paid through construction spending on the project itself, it creates indirect jobs for workers at building material suppliers and businesses providing support services, such as trucking and architectural design, it generates income for local businesses when workers spend their wages and it increases government revenues. Moreover, after construction, economic impacts continue through spending by households residing in the units and building operations and maintenance.
To quantify the local economic benefits of affordable housing we use a three-step approach. First, we review the National Association of Home Builders (NAHB) economic impact model. NAHB’s modeling algorithms are comprehensive and provide definitive benchmark values for the industry. We then incorporate Rutgers-National Park Service’s Historic Tax Credit state level economic impact data to capture how impacts vary from state to state, and we adjust NAHB’s national impact levels accordingly. Finally, we map state level impacts into more geographic specific values by applying U.S. Department of Housing and Urban Development (HUD) 2019 Fair Market Rent data. We conclude the paper with an assessment of our assumptions and methodology to generate local estimates.
NAHB Estimation of the Economic Impacts for Multifamily Rentals
The NAHB model estimates the economic benefits of building single-family homes, multifamily rental units and residential remodeling in three phases:
- The direct and indirect effects during construction—the jobs, wages and local taxes generated by the actual development, construction and sale of the home. These include on- and off-site construction work and other work and materials required to build the home and deliver it to the customer.
- The induced effect during construction (aka the multiplier or ripple effect)—This effect maps the income and taxes generated in Phase 1 into spending on locally produced goods and services, and then estimates the additional wages and profits that accrue to local area residents and the additional local tax receipts.
- The ongoing impact—the local jobs, income and taxes generated on an ongoing basis after construction is completed. Phase 3 is similar in spirit to Phase 2 in that it involves estimating the total ripple effect of economic activity generated each year.
NAHB computes these impacts based on a complex set of benchmark data tables and models that can be calibrated and customized to the goods and services produced, sold and consumed within local economies. It then rolls up the local economic impacts to an aggregated level and publishes the average impacts for a “typical local area” in the paper.
Table 1 shows NAHB’s estimated one-year impacts of building 100 multifamily rental units in a typical local area.
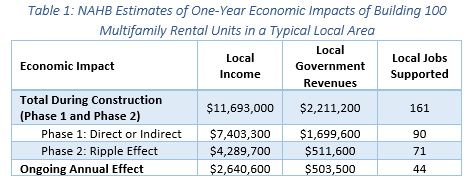
Note that these local economic impacts are based on multifamily units that have an assumed average market value of $145,000 (including raw land value of $14,000 and $13,672 in permits, local government fees, etc.) and an assumed average annual property tax of $1,626 per unit.
Adjusting NAHB National Level Impacts for Each State
The NAHB paper provides definitive benchmark values for a nationally representative locality. To adjust these national estimates to the state level we use the results from the most recently available Rutgers/National Park Service Historic Tax Credit paper (referenced above) that quantifies the economic impact, by state, of the Federal Historic Tax Credit (HTC) for Fiscal Year 2017 and the cumulative impact for fiscal years 2013 to 2017.
The HTC is designed to encourage private investors to preserve and re-use historic buildings through a 20 percent federal tax credit for substantial rehabilitation. As noted by the Office of the Comptroller of the Currency, since the Tax Reform Act of 1976, the HTC has helped rehabilitate over 42,000 certified historic buildings and has brought in more than $84 billion of new private capital.
While we are not arguing that the local economic impacts of the HTC can be directly compared on an apples-to-apples basis to the economic impacts of affordable housing construction, we use the HTC data to compute state level adjustments from nationally representative economic impacts by computing the relative differences across states in the HTC data. We then assume that these relative state level differences are suitable to adjust NAHB’s economic impacts estimates (shown in Table 1).
Table 2 shows the economic impacts of HTC related investment for 2013 to 2017 at the national level and for the ten largest rehabilitation cost states.

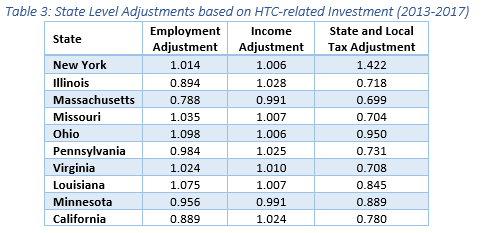
To illustrate how we calculate the state adjustments, we focus on the employment adjustment for New York. Nationally, the employment impact is 15.94 jobs for every $1 million in rehabilitation costs (= 436,012/$27,349 million). In New York, the corresponding impact is 16.16 jobs. The employment impact in New York is thus 1.4 percent higher than for the U.S., so that for each job created (on average) at the national level, 1.014 jobs are created in New York State. Table 3 shows the adjustments for the same ten states as in Table 2.
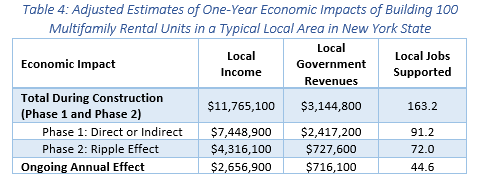
In Table 4 we replicate the national results from Table 1 but show the adjusted results for New York State.
Mapping State Level Impacts into Local Impacts
The state level economic impacts, as illustrated for New York State in Table 4, are based on multifamily units that have an assumed average market value of $145,000. These data are based on the NAHB publication from 2015 and thus need to be updated to 2019 values. Moreover, they do not consider variation in market values across locations within the state.
We adjust the state level impacts, as illustrated in Table 4, using HUD’s 2019 two-bedroom Fair Market Rent (FMR) data. These data provide rent levels for 2019 and geographic variation. To illustrate, we continue our example from New York State, and use three data points: Albany-Schenectady-Troy where the two-bedroom FMR is $1,115, New York Metro where it is $1,831, and Buffalo-Cheektowaga-Niagara Falls where it is $838.
To make the adjustment, we map the $145,000 market value into an FMR by assuming that the FMR is in the range between 0.8 percent and 1.1 percent of the market value. We use the mid-point (= 0.95 percent) so that adjustments are made relative to a base FMR equal to $1,378 (= $145,000 * 0.0095).
We make the state to local area economic impact adjustments with the following assumptions:
- The employment impact within a state does not change with FMR. That is, irrespective if the units are in Albany, New York Metro or Buffalo, the number of local jobs supported are the same as in Table 4.
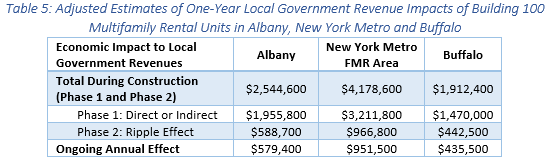
- Tax revenues change by the full extent of the variation in FMR. For example, the ongoing annual effect on local revenues in Buffalo is estimated to be $435,480 (= $716,100 * ($838/$1,378)).
Local tax revenue impacts are illustrated in Table 5.
While it is reasonable to argue that the number of jobs supported does not vary with FMR within a state, and that local government revenues have an equal proportional change as FMR, it is more complex to determine the share of an FMR change that accrues to local incomes.
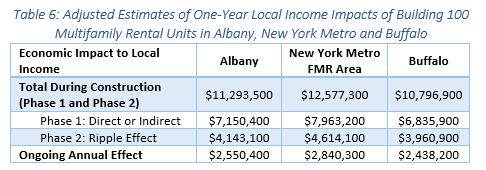
To assess the variation in local incomes we examine a recent Abt study that examines variation in development costs for LIHTC projects. The Abt study, that analyzes development cost data for more than 2,500 LIHTC projects placed into service between 2011 and 2016, shows that an increase of $1,000 in average annual construction wages is associated with a statistically significant increase in per-unit total development cost of approximately $4,700. That is, a $1 increase in total development costs increases construction wages by .21₵
Based on this, we assume that a $1 increase (decrease) in FMR leads to a .21 cent increase (decrease) in the local income impact. Table 6 demonstrates the local income economic impacts for Albany, New York metro and Buffalo.
Putting all these together, in Table 7 we replicate the state results from Table 4 but show the adjusted results for New York metro.

Note that while we have illustrated the impacts in three metro areas in New York state, these results can be replicated for any of the FMR defined metropolitan areas and counties.
Closing Thoughts
Measuring the economic impact of construction is, in many respects, more of an art than a science. However, it is important for affordable housing practitioners to be able to quantify the benefits of developing new projects—especially when we face an acute shortage of affordable and available units, and other forces, such as NIMBYism, are slowing progress.
In this article, we propose a three-step methodology to estimate economic impacts during construction and ongoing after projects are occupied that can be replicated for any HUD FMR defined metropolitan area and county. While we have made multiple assumptions and judgments to compute local economic impacts, we believe our estimates provide judicious measures of the benefits to the local population that can be used to advocate for increased levels of affordable housing development.