Economic Research Report: Determining Rents in Mixed-Income Properties
By Edward Seiler
5 min read
A data design that can help us
Background
Mixed-income development is of increasing importance in the affordable housing industry. Academic studies show evidence of the economic benefits of mixed-income environments to low-income households, as well as to society for which they alleviate poverty concentration. Such studies have helped promote policies, such as income averaging (IA) that encourage development of mixed-income properties. In addition, current market conditions are incentivizing developers to offer even more mixed-income affordable projects with market-rate and moderate-income (workforce) units in order to increase their cash flow.
In planning these properties, developers need to optimally configure projects to deliver sustainable mixed-income arrangements. You need to determine what market rents should be set at when the affordable rents are known.
To help developers and market analysts make these determinations, we think it can be of value to look at a novel dataset of monthly unit rents for a sample of mixed-income properties. This national dataset, assembled by Vogt Strategic Insights (VSI), includes both market-rate rents and rents at 50 percent and 60 percent area medium income (AMI) levels from 932 family and senior Low Income Housing Tax Credit (LIHTC) financed developments. This dataset can provide a prototype for future data collection.
The detailed data design presented here can then be expanded to help calculate optimal rents for projects that include other various AMI levels and unit characteristics and amenities. This aspect is especially important given the current focus on IA, the trending towards 70 percent and 80 percent Area Median Household Income (AMHI) units in the mixed-income property unit mix and the variety of features and amenities that can impact rent.
VSI Dataset
The VSI data consists of a sample of 932 family and senior projects across the United States with data values reported in 2017 and 2018. For each project, VSI has detailed data on project name and location, the number of units by AMI level and the number of market-rate units and reported street rents (that are recorded without adjustments for utilities).
The detailed data profile for each project allows VSI to compare rents, by bedroom count, for all unit types, including market-rate units and units with various levels of AMI. Then we can look at data aggregated by location. This is illustrated in Table 1, which shows aggregated data for seven family projects in Arizona consisting of 1,217 units.
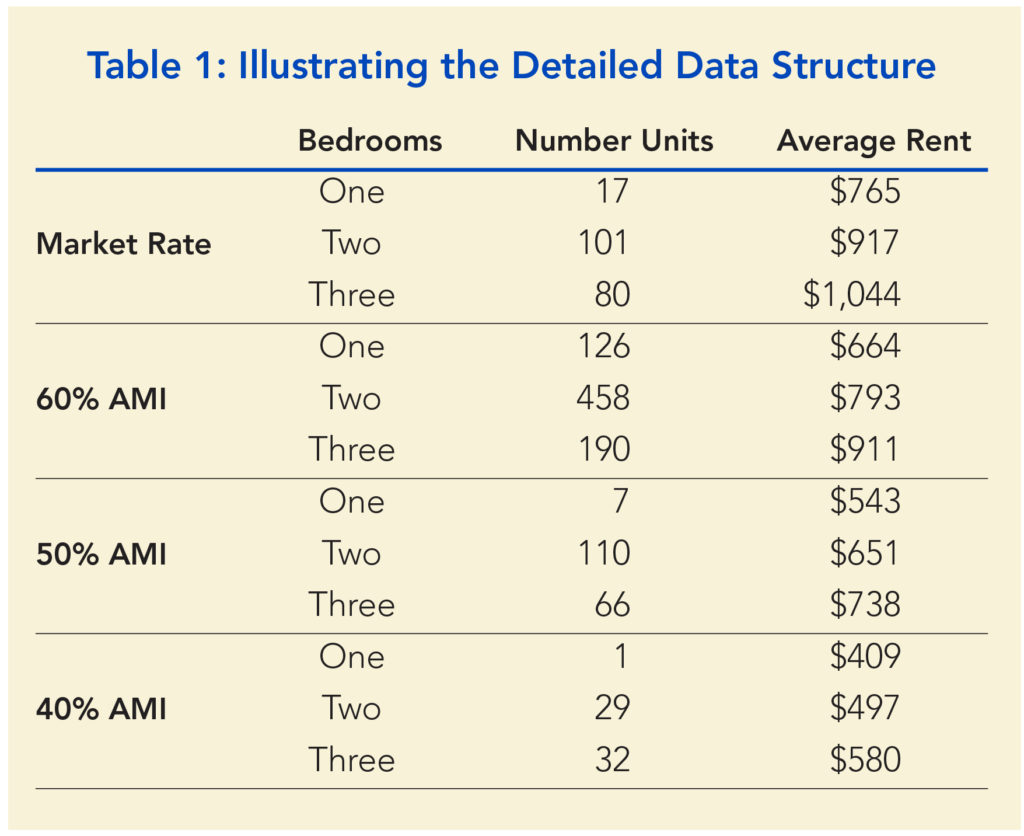
The table highlights:
- A comparison of average rent differences between the market-rate and various AMI rents by bedroom count. For example, for properties containing two-bedroom units, the average market rate rent is $917 versus $793 for the 50 percent AMI units (a difference of 13.5 percentage points).
- The distribution of units in the aggregated projects: In thisselection, 16 percent are market-rate, five percent 40 percent AMI, 15 percent are 50 percent AMI and 64 percent are 60 percent AMI.
This data design thus allows us to examine unit types within a property to calculate rent differences. While these comparisons include location characteristics, the data could potentially be improved by adding unit characteristics. For example: story, view (e.g., street versus interior), amenities (e.g., washer/dryer, fireplace, parking) and the square footage of the unit. While the VSI data does not include every desired unit characteristic, it provides a valuable prototype for future research and analysis.
Balancing Market-Rate and Affordable
In this section, we use the VSI data to gain insights on the relationship between market-rate and affordable rents. We focus on the 702 family living projects in the VSI data (that comprise 91,348 units). Furthermore, for clarity, we present the results without differentiating for bedroom count.
Table 2 presents summary statistics for average differences between market-rent and both 50 and 60 percent AMI rents within the same property for the ten largest states (by unit count) in the VSI sample.
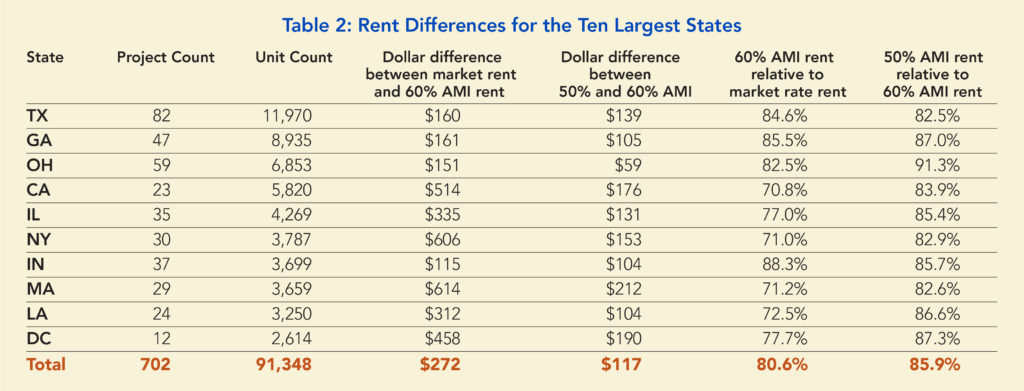
The average difference between the market-rate rent and the 60 percent AMHI rent, for all 91,348 units, is $272. That is, a 19.4 percent relative difference. The magnitude is larger (in absolute and relative terms) in higher rent cost states (CA, NY and MA) and smaller in lower rent cost states (TX, GA, OH and IN). The relative differences between the 50 percent and 60 percent AMHI rents are all near the overall average difference of 14 percent (except for OH).
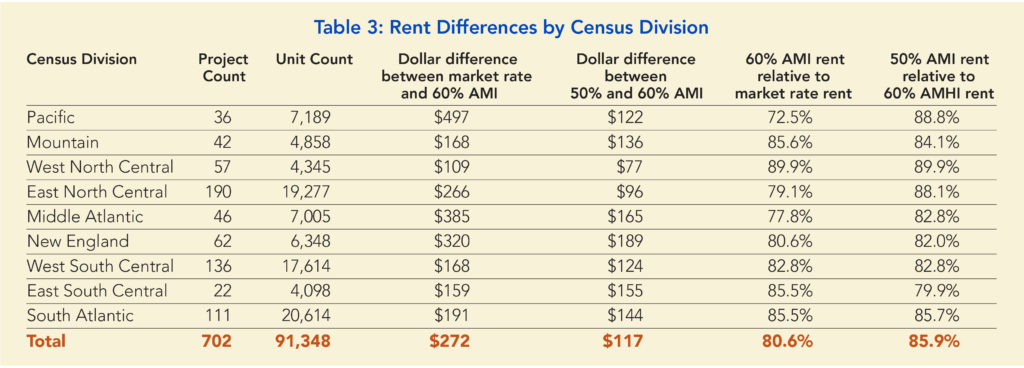
In Table 3 we present the same summary statistics by Census Division.
Summary
The VSI data provides a framework to help developers creatively structure their mixed-income projects. As our current market now includes IA and a focus on workforce housing, this provides a model with which we can accumulate and
compare data to make decisions. The ultimate relationship among the choice of various rental units needs to be verified by the market analysts based on current market conditions.
The data included here is a sample for illustration. VSI data is more comprehensive than what is presented here and includes AMI levels from zero to 80 percent. Though this data is on all family living projects, at a later date, VSI will also have available specific data compiled on senior living.