Housing Affordability Includes Commuting Costs
By Edward Seiler & Mathew Dietzel
6 min read
Longer travel causes stress and impacts health
Introduction
Rental-housing affordability is a serious issue for many essential moderate-income (“workforce”) workers – especially in more affluent population centers. The commonly used measure of affordability (rent and utility payments relative to household income) does not provide a comprehensive assessment as it does not reflect, among other things, the costs of travel to daily destinations. A more accurate assessment would also consider proximity to the workplace and associated pecuniary, time and health costs of commuting. In order to build location-efficient affordable housing, planners need to consider the combined cost burdens of housing and transportation.
Quantifying Housing and Transportation Costs
In a 2012 study, the Center for Housing Policy and Center for Neighborhood Technology (CNT) discussed how moderate-income households were losing financial ground on two fronts due to the rising costs of housing and of transportation. The study showed that moderate-income homeowners pay a disproportionate share for housing and transportation (H+T) costs (equal to 59 percent of household income versus 33 percent for above median-income households).
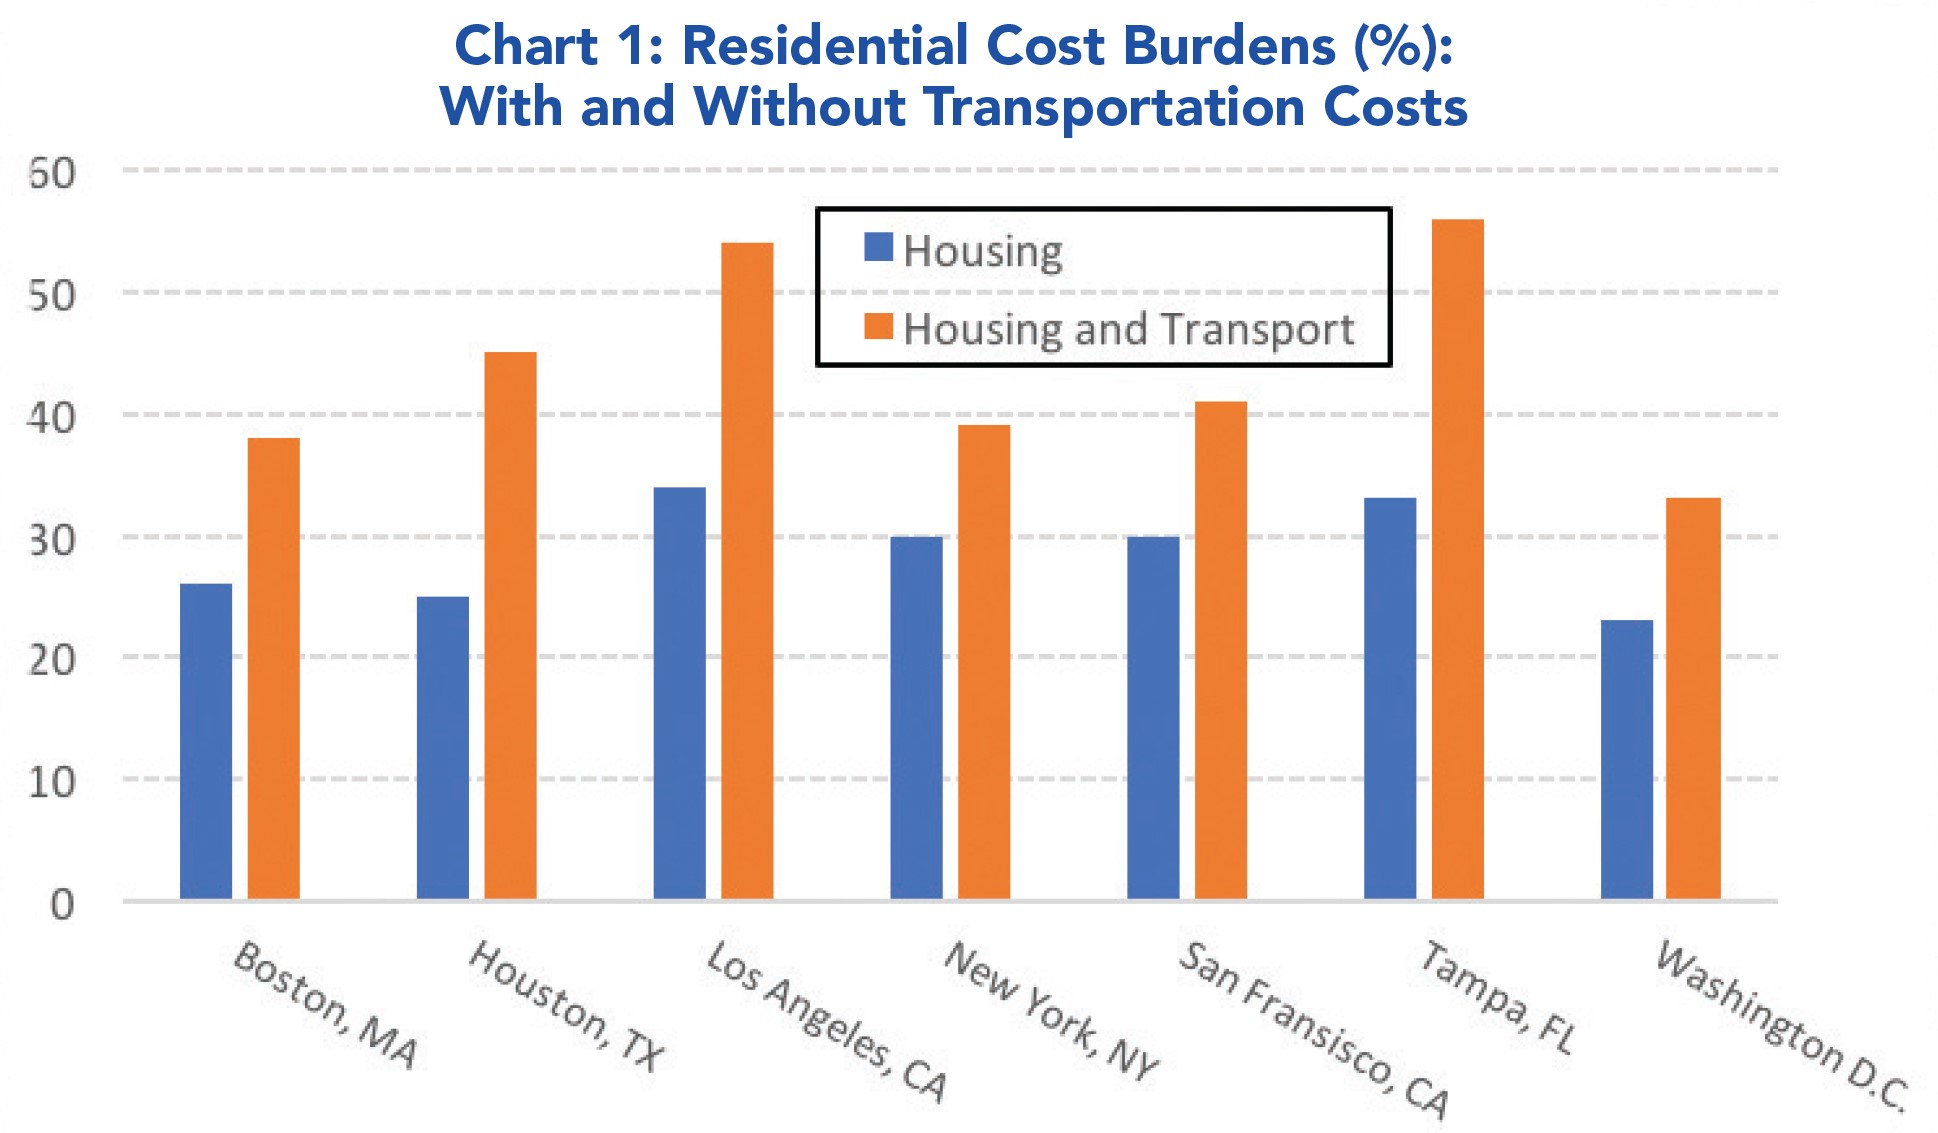
The study also showed that combined H+T cost burdens can change the geographic calculus of affordability. For example, in Chart 1, the cost burden for housing, as a percentage of average area household income, is higher in Boston than in Houston (blue columns). Adding in transportation costs, that are relatively high in sprawling Houston, reverses this relationship (orange columns).
—————–
CNT’s H+T Affordability Index
CNT publishes a geographically granular H+T Index (see https://htaindex.cnt.org/) that provides affordability and location efficiency metrics.
For example, CNT’s 2017 Fact Sheet for Riverside-San Bernardino-Ontario, CA shows a lack of location efficient neighborhoods, that average annual transportation costs are $14,262 (=26 percent average income), and that housing costs are 33 percent of average income. This leaves just 41 percent of income for non-H+T costs.
Interestingly, the CNT Fact Sheets also include information on greenhouse gas emissions. We will further discuss the “social costs” of commuting and location inefficiency later in this article.
—————–
Transportation Costs are High, and Commutes are Getting Longer
When affordable housing is only available in a far-away place, time also becomes a more significant economic expense. As an alternative to paying expensive rents closer to city centers more people are opting for longer commutes. For example, Zillow reports that renters in Seattle with a commute of less than 20 minutes pay 34 percent more per square foot than those who have a 20 to 40-minute commute. Consequently, the average commute time nationwide is up to 26 minutes (from 21.7 minutes in 1980).
A recent Brookings study showed that the number of jobs in major metro areas within a typical commute fell by seven percent between 2000 and 2012. Moreover, this change adversely affected poor and minority residents. The number of jobs near poor residents fell by 17 percent, and the corresponding decreases for Hispanic and black residents were 17 and 14 percent. The authors of this study underscore that their findings “point to the need for more integrated and collaborative regional strategies around economic development, housing, transportation and workforce decisions that take job proximity into account.”
Also, the number of commuters who travel for longer than 90 minutes one-way (aka “super-commuters”) has pointedly increased over the past decade. For example, in Massachusetts, from 2010 to 2015, median rent increased 15 percent and the number of super-commuters increased by 45 percent. And a 2017 report from Apartment List estimates that ten percent of residents in Stockton, CA (situated 75 miles east of Oakland) are super-commuters, and in Riverside (situated 55 miles east of Los Angeles), the figure is 7.3 pecent. Even within cities, there are significant numbers of people who face these daunting commutes. In New York City, about 6.7 percent of residents super-commute, and in San Francisco, 4.3 percent do so. While super-commute rates are not increasing everywhere, it is a nationwide problem – the U.S. Census Bureau estimates that the number of super-commuters increased by 30 percent between 2005-16.
Most super-commuters have lower incomes. According to a NYU study, in nine out of ten metropolitan counties studied, more than half of the super-commuters earned less than $40,000, and a Pew Research Center study of Minnesota’s workforce found that between 2010 and 2015, the proportion of super-commuting teachers and police officers rose by almost 30 percent.
Along with time, these long commutes yield several other kinds of economic costs. They add to traffic, place greater strain on public transit systems, and over the long-term, can lead to various health issues.
—————–
Externalities
- Economists refer to a side effect or consequence of an activity that affects an external third party who did not choose to incur that cost or benefit as externalities. (See: https://en.wikipedia.org/wiki/Externality).
- Positive externalities provide “social” benefits. For example, by keeping my lawn beautiful, neighbors who walk by may benefit.
- A negative externality is an effect of an individual’s choice that yields a social burden or other kind of detrimental cost to an external third party.
- Commuting by car creates multiple negative externalities:
- The greenhouse gas emissions may affect another person’s health. Pollution also causes damage to forests, crops and buildings.
- Commuting causes noise pollution.
- As additional drivers use public roads, congestion increases and commute times are longer. A greater number of drivers also increases the likelihood of traffic accidents.
—————–
Long Commutes and Health
The costs of a long commute include psychological and physical tolls. A long commute adds stress to an already busy life, adds fatigue to an already tiring workday, reduces free time that could be spent with family or exercising, and more.
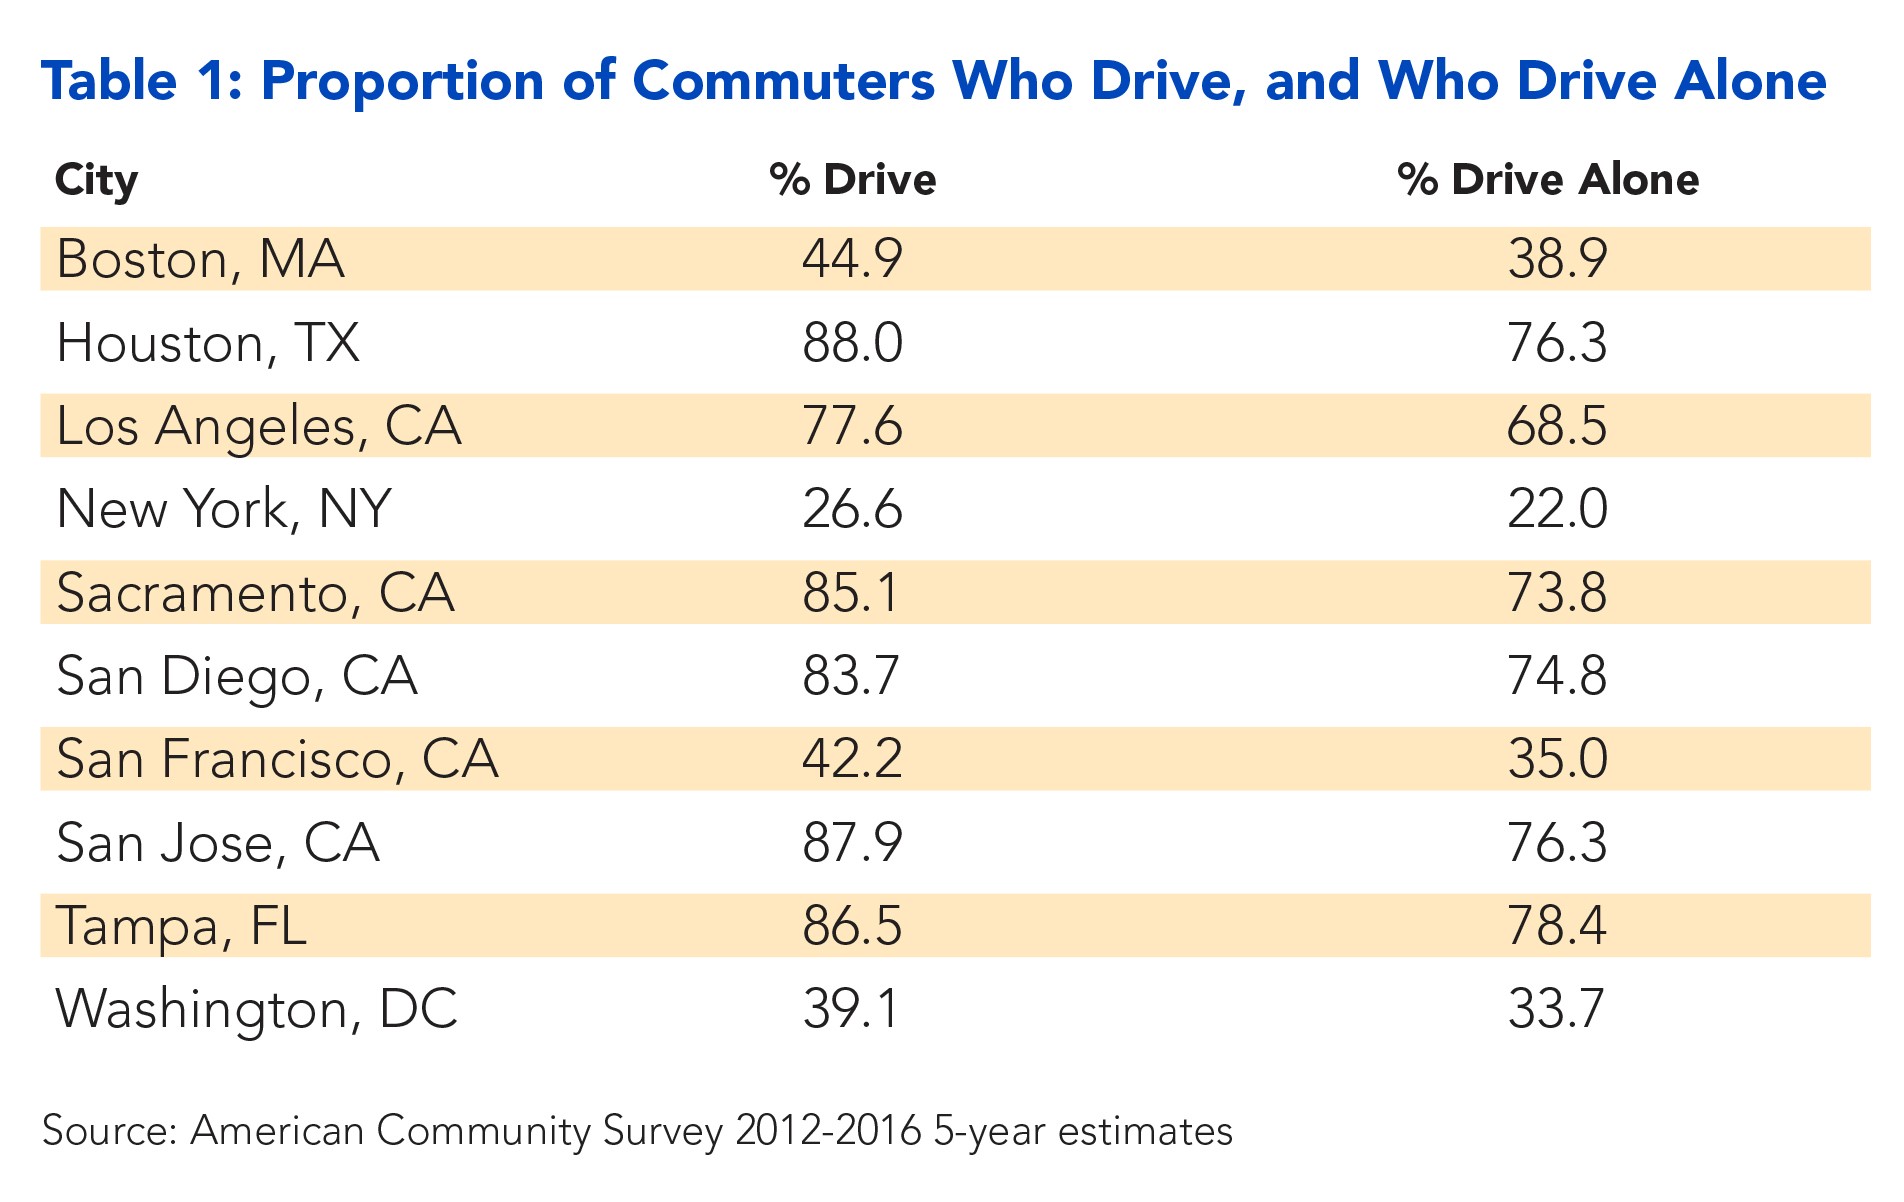
The good news is that a commute that involves walking may be a benefit, rather than a cost. Also, better public transport connectivity is associated with lower mental distress12. With that said, public transportation often adds significant time to commutes. In addition, as seen in Table 1, most commuters still drive to work in many metro areas—even those with relatively good public transportation systems.
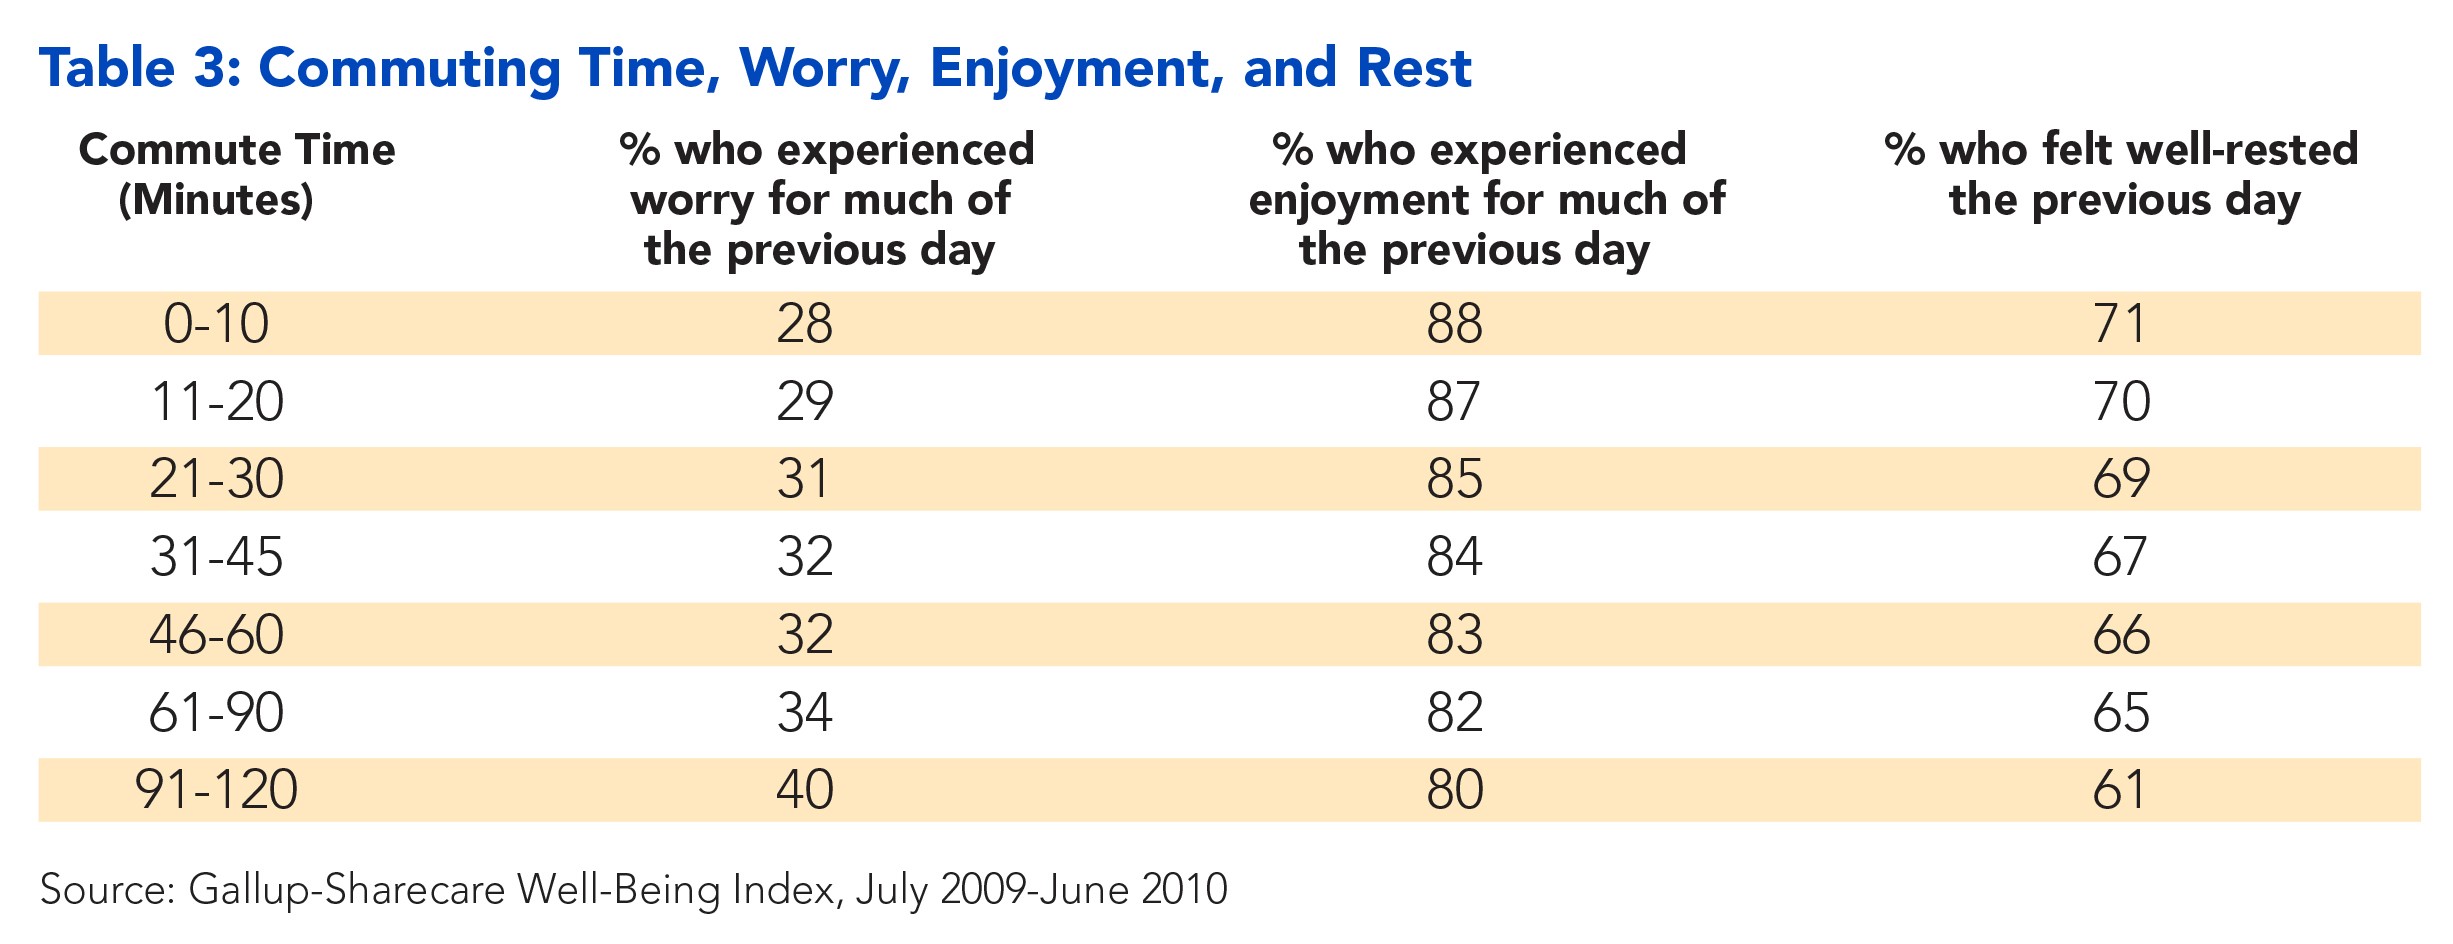
To quantify the adverse physical and emotional costs of commuting, we utilize the Gallup-Sharecare Well-Being Index.This index, based on a phone survey of approximately 175,000 employed adults from about 160 metropolitan areas across the country, scores well-being on a zero to 100 scale, with a higher number indicating increased well-being13. The survey includes questions asking about indicators of physical and mental well-being. Table 2 shows the relationship between commute time and well-being, and Table 3 shows how individuals with different commute times responded to some of the emotional health-related questions.
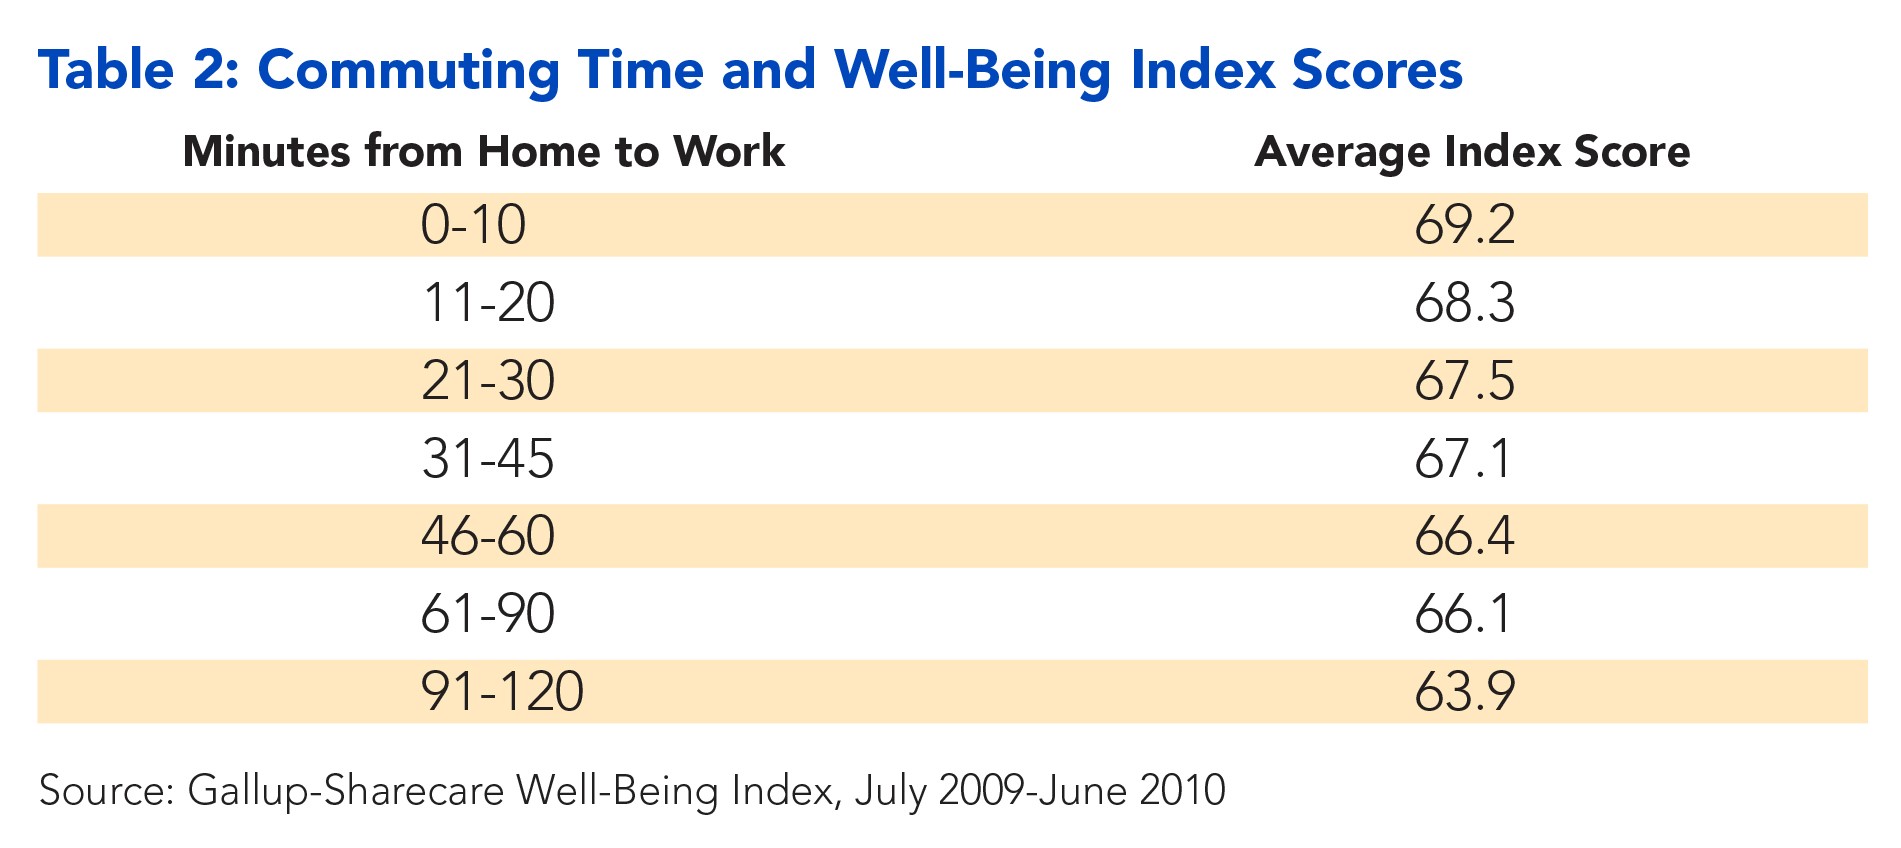
This data implies that long commutes have negative effects on workers’ well-being14. This is true for physical health inputs into the index (e.g., neck or back pain, high cholesterol and obesity), and for emotional health (as in Table 3).
In Closing
Affordability is a function of rental-housing costs and transportation costs. Because renters face a trade-off between higher rents and longer commutes, a comprehensive economic development strategy needs to promote location-efficient affordable housing. This is a major challenge for planners, who must also consider factors, including school quality, neighborhood safety, fair housing concerns and the environment. Ultimately, if affordable housing professionals want to achieve the goal of allowing households to live in affordable, stable homes, the challenge of accounting for transportation needs cannot be ignored.